
Enter The Zombie
Infected with the mindless, biological drive to step out on the risk spectrum

A zombie is a reanimated corpse that has lost free will. Zombies act under some form of biological drive, mindlessly droning forward looking to satisfy their hunger for flesh and brains.
A zombie market is one that infects traders as it grinds steadily higher, in an apparent riskless state, benefitting from the light tailwinds of passive inflows and derivative hedging. Traders, unconcerned with downside risk, mindlessly chase higher returns in riskier assets: memes & themes.
A few weeks ago we put out our Monthly OPEX analysis, entitled “HoneyBadgers & Zombies”. Core to that was analysis was that if Powell tilted towards a cut, and NVDA earnings are okay (8/27), the S&P500 could enter a final bullish grind which we dubbed: the Zombie.
Before we dive in, go get our free new daily report called “FlowPatrol” which highlights all of the largest changes in Hedge Fund options positioning.
The Zombie is what happens when the volatility of the S&P500 drops to historic lower bounds, locked in tight trading ranges while grinding persistently higher. As traders get comfortable with a perceived lack of risk in equities due to very low index volatility, they may start to chase specific meme stocks or popular themes, like OPEN or AI, in order to amplify returns.
(Consider the opposite environment - when stocks are crashing and the VIX spikes sharply - in that environment there is no one chasing a small cap quantum computing stock, or a busty low end retailer.)
Powell clearing-for-a-cut at Jackson Hole has already unlocked some short options /short volatility trades (see “Extra Credit” at the bottom) - positions which lead to hedging flows that blanket S&P500 volatility. The more volatility that is sold, the heavier the blanket on S&P500 movement.
Why would these traders increase short volatility positions in a low volatility environment?
Over 60% of SPX index options trading is now 0DTE. This signals that a great deal of volume does care not about risks 3 or 6 months from now, its about the perceived risk for today.

Given that, traders may elect to chase upside because the period from now until the September FOMC is likely to be seen as “risk-free” because of the implied support of both fiscal and, now, monetary policy. If NVDA’s ER also keep the AI-theme engaged, then traders can also continue belief in the AI/semi growth driver.
How can you visualize the Zombie?
As the S&P500 movement decreases, that is to say realized volatility [RV] declines, we believe traders start to turn toward flashier returns in more speculative stocks and assets: memes & themes.
As a way to visualize a “zombie chase”, we present the CBOE 1-month Correlation Index (COR1M). COR1M measures the options prices for the top 50 stocks in the S&P500 index vs the prices of SPX index options.
When COR1M declines, its a signal that traders are bidding up the prices of options (particularly calls) in individual stocks like TSLA, NVDA, etc, vs those of the SPX. Further pressuring correlation may be traders selling options in the SPX, which further depresses SPX options prices relative to single stocks.
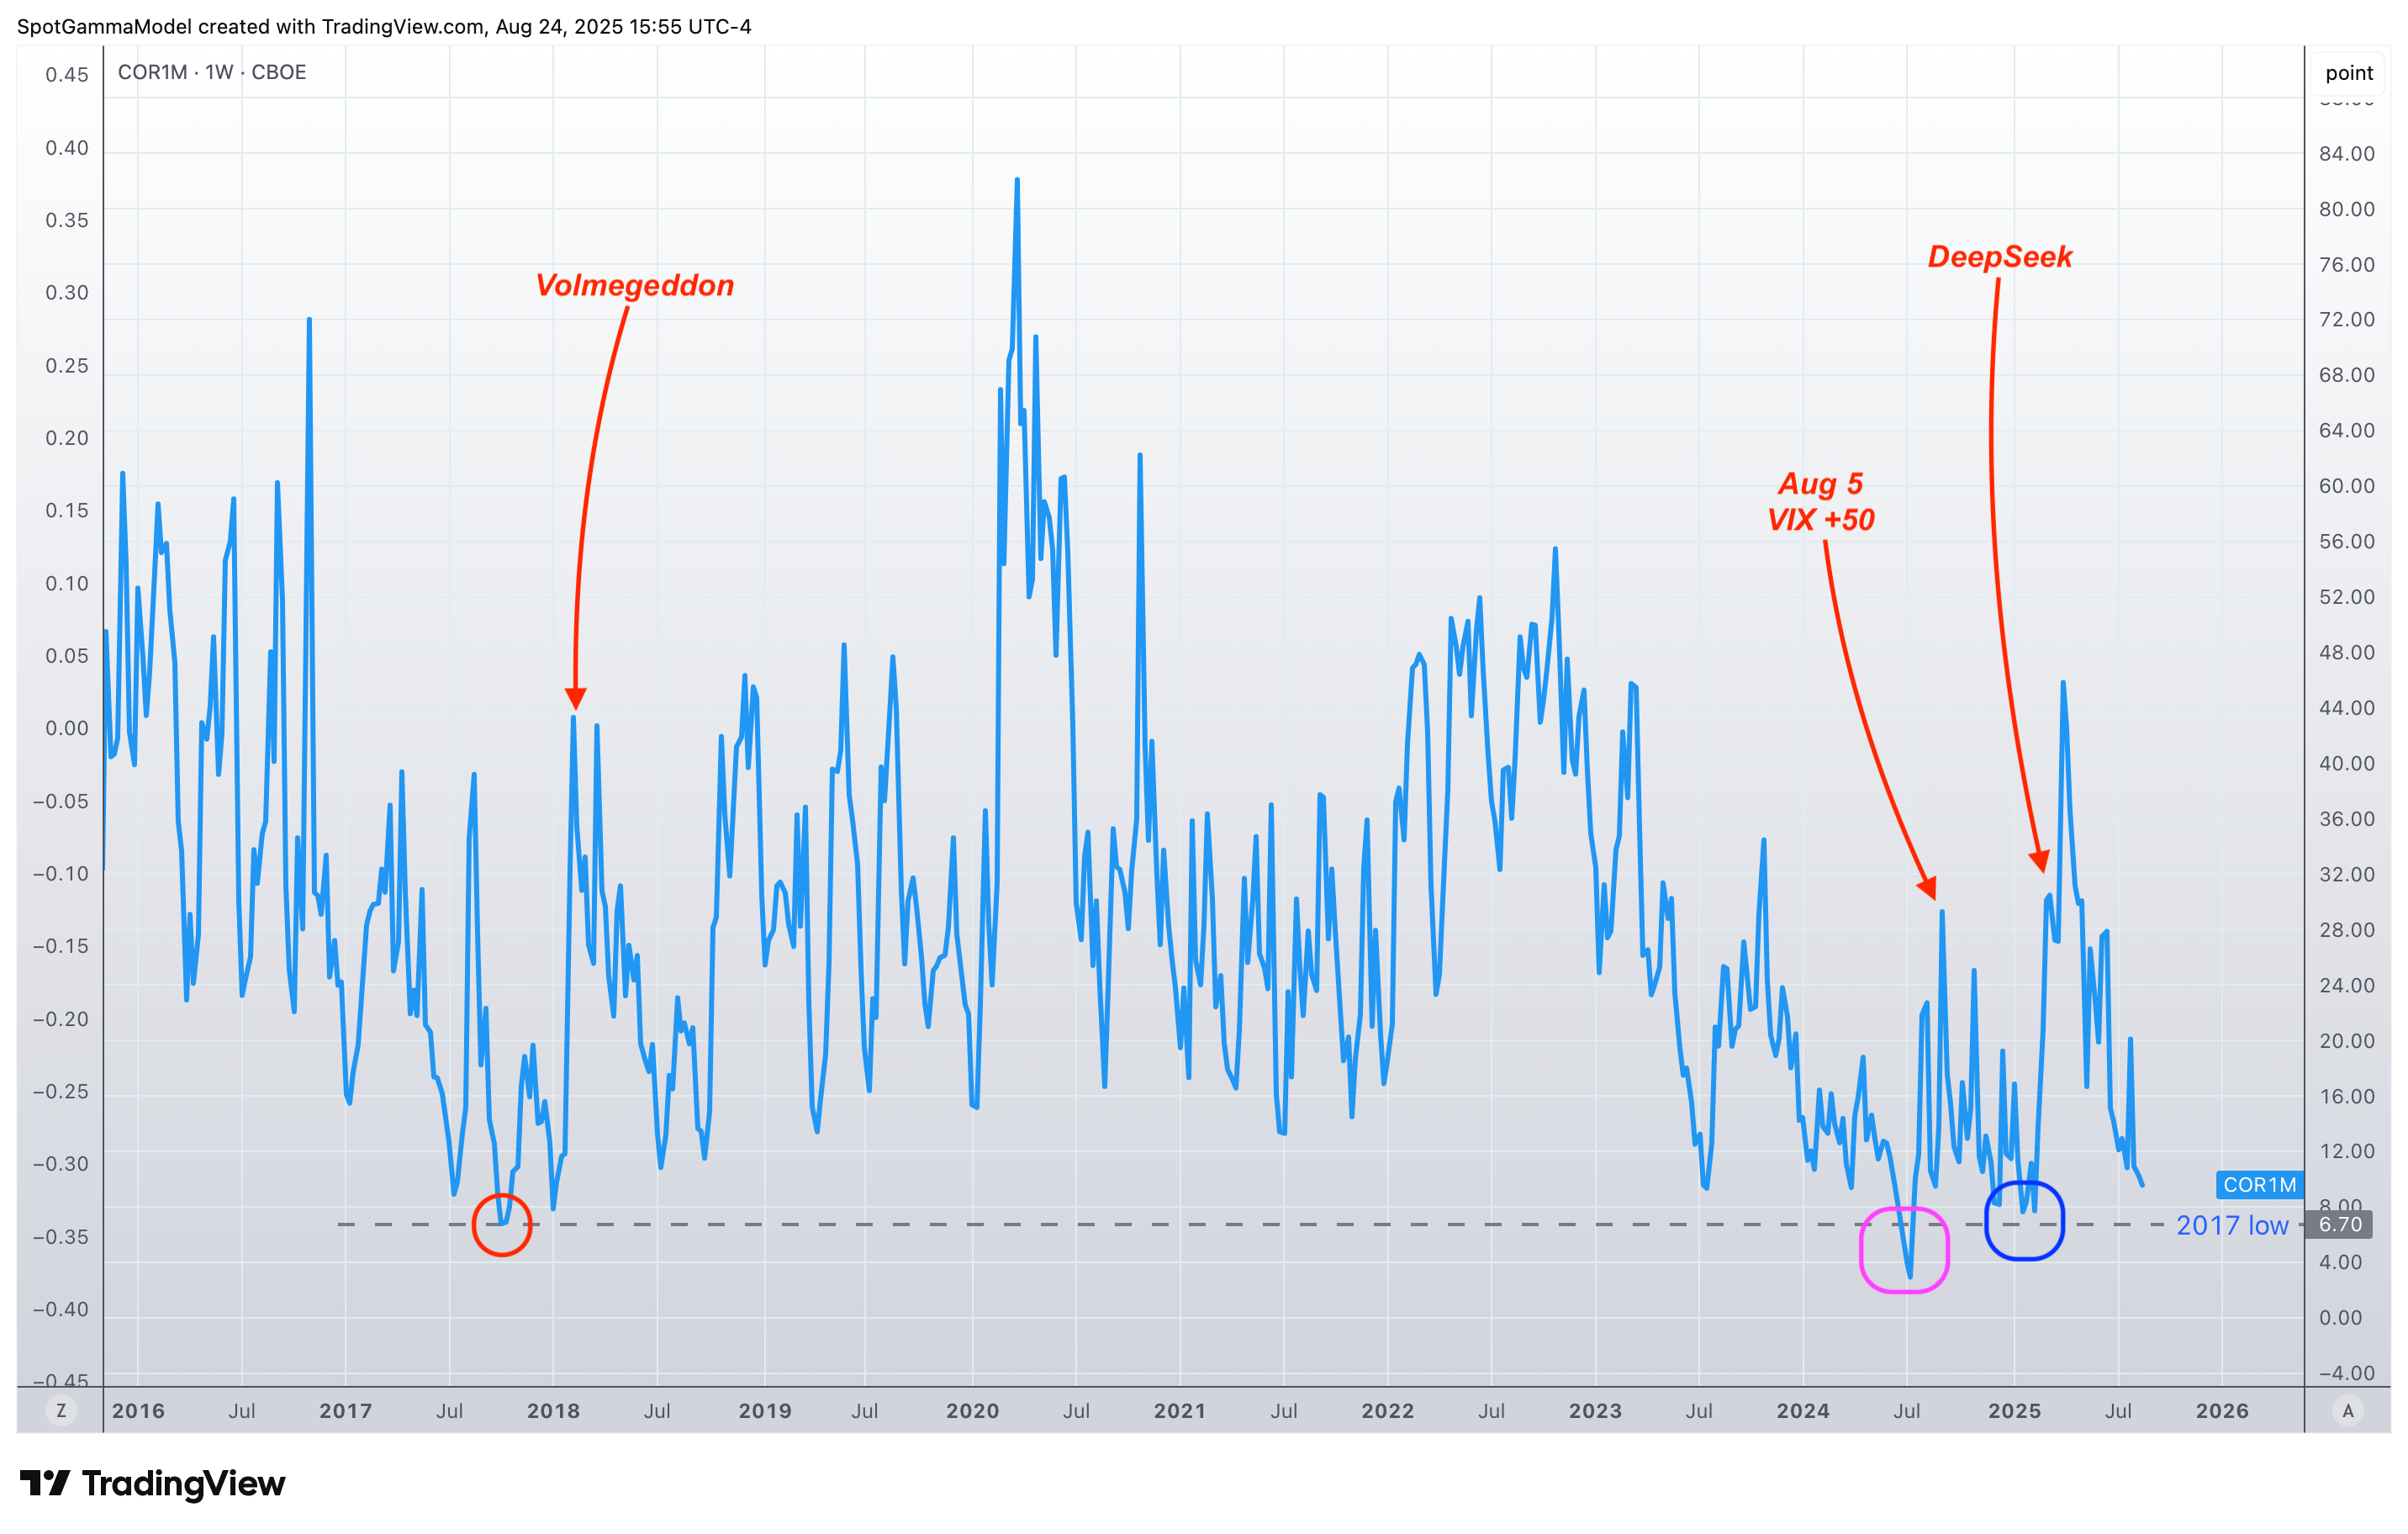
Conversely, when markets crash, all stocks are sold, and all options prices spike higher in unison. Accordingly, this causes COR1M to jump higher. We’ve dubbed these correlated leaps higher in options prices as “correlation spasms”.
The lows in correlation often time with the lows in SPX realized volatility. The most famous of these low volatility time periods was late 2017, when SPX realized volatility hit 3.4%. With this low volatility environment, traders sought every opportunity to harvest the “free alpha” trade of shorting volatility - eventually this led to Volmegeddon in early 2018 as those short volatility trades were all blown out (i.e. XIV).
More recently, COR1M hit all time lows in July of 2024 after NVDA and the AI trade surged to record concentration levels. That period ended with VIX going to +50 after a massive stock decline in July. See this piece on “Correlation Spasms” from July 2024.
The last occurrence of a correlation spasm was the infamous DeepSeek crash in February, which resulted in a massive 14% NVDA decline.
Post 2017 the lowest 1-month SPX realized volatility is ~6%, which equates to average daily SPX moves of 37bps. Its actually quite rare in the post-Covid area to see SPX realized vol at 6%. Consider the plot below which shows SPX 1-month RV (yellow), with periods of <8% RV highlighted in pink.
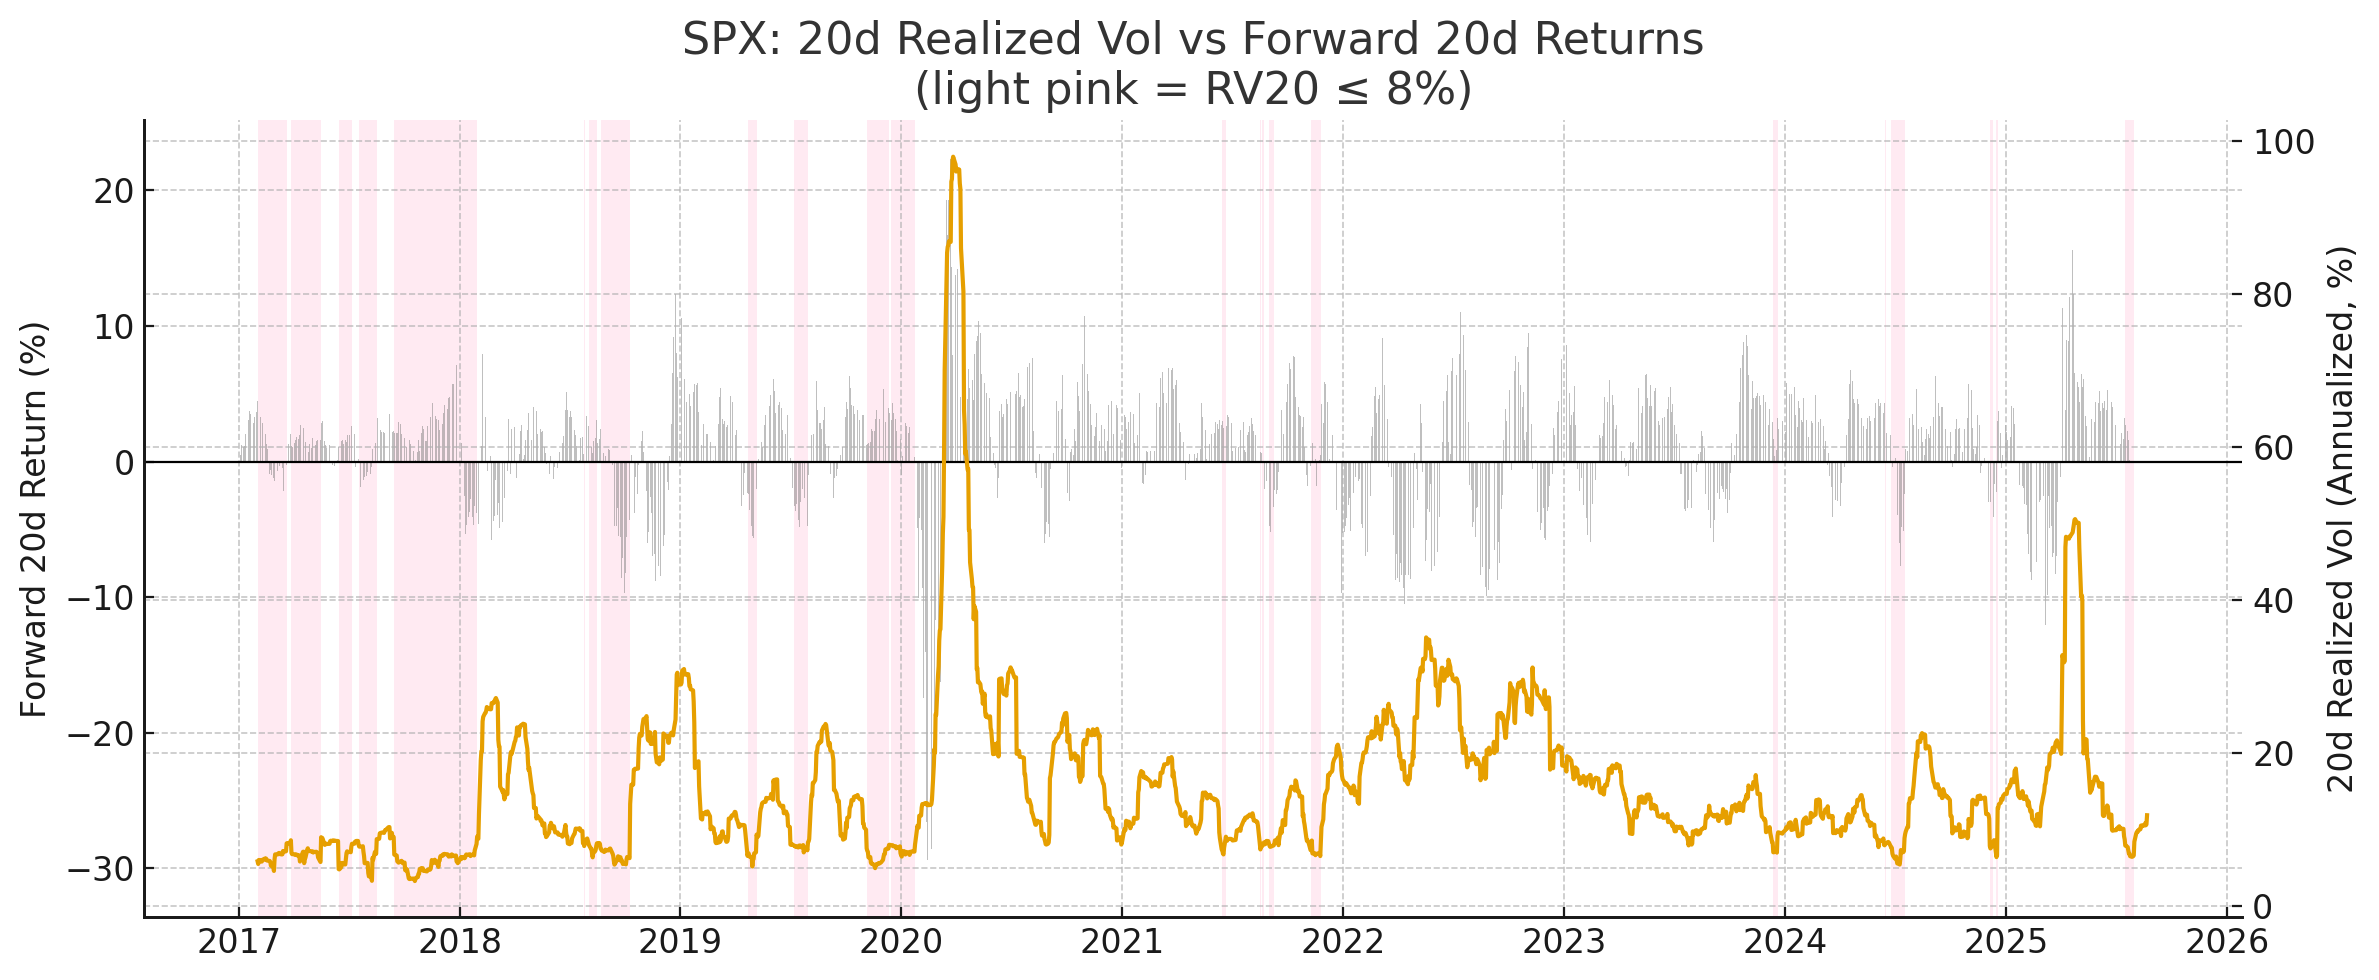
There are a few key observations here:
In the Trump 1.0 era there were extended periods of very low volatility, which correlated with positive 1-month SPX returns (gray bars)
Periods of low volatility post-covid have been very short, and often end with negative forward returns
Our deep thoughts around why this is a bit off topic - the summary here is that over the last 5 yeas these low RV periods often end with a period stock selling: 7/10 occurrences post-2020 see negative forward returns.
What’s the Trade?
If this plays out as we think, a positive NVDA earnings report will usher in very dull, low S&P500 Index volatility period (SPX RV goes to ~6%, pre-FOMC IV’s go to 8%), which may also result in positive SPX returns. The Zombie.
Those returns would be outpaced by gains in the hottest memes & themes: AI, small caps, etc. We could then see the CBOE COR1M get into the 8’s, validating the idea that there is excess bullishness.
The period of calm, and excess memes & themes returns, could come to a halt at September Options expiration (9/19), which falls just 2 days after this pivotal FOMC & VIX expiration (9/17).
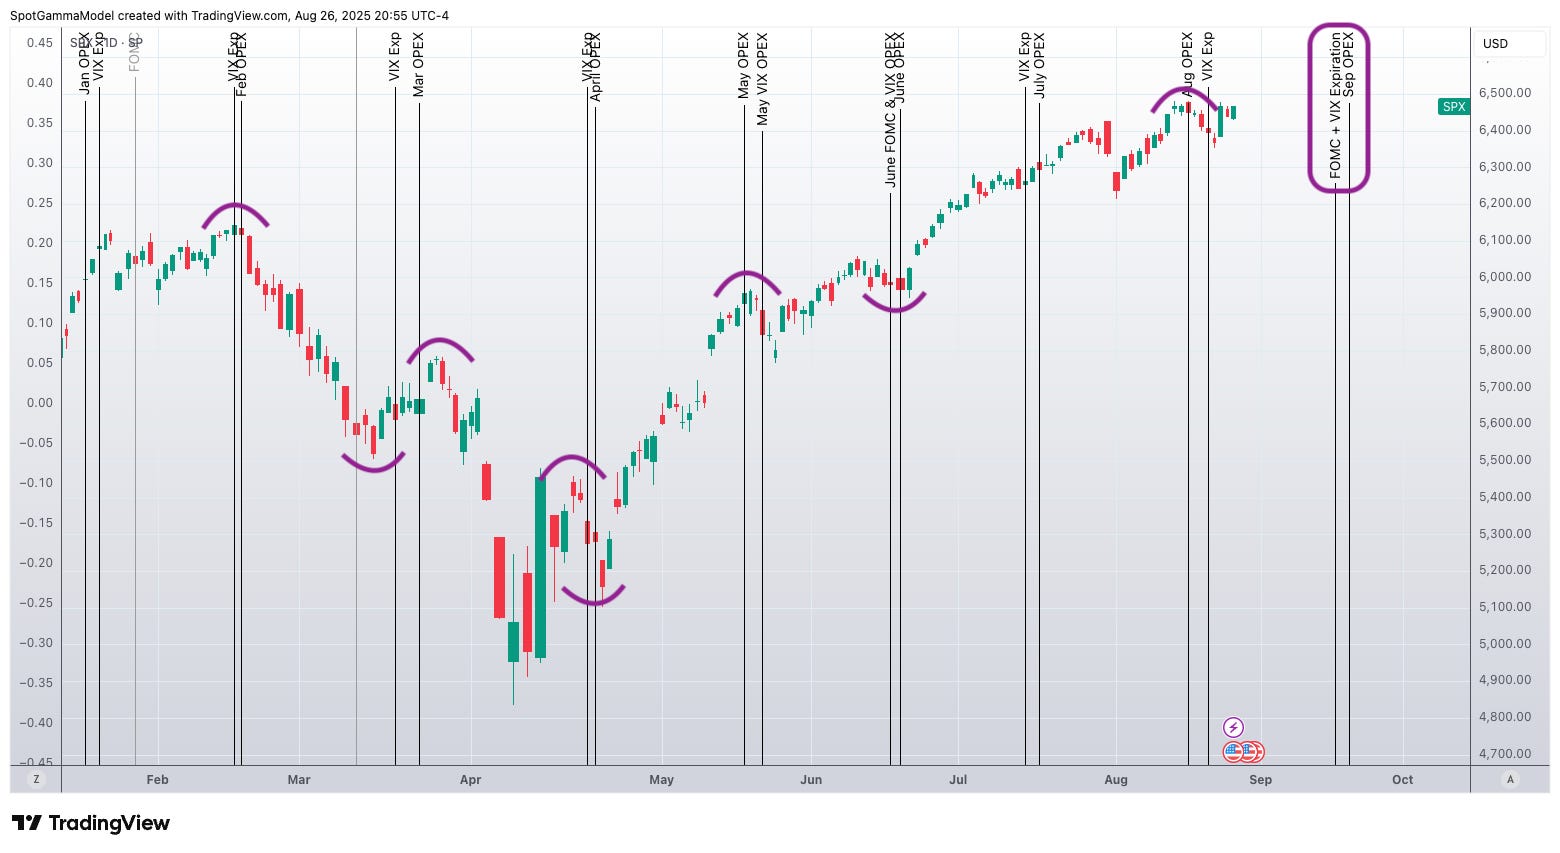
The chart below measures the change (“Delta” or difference) in SPX realized volatility (RV) into options expirations. In this case, what you see is that for the week into options expirations, volatility tends to contract (thus the red bars). Accordingly, after expiration, volatility expands. We believe the shift in large options positions at OPEX can be the trigger for volatility to expand.

Extra Credit
Bloomberg recently released this chart showing that traders are shorting VIX futures are the highest levels since mid 2022.

Extra Extra Credit: What if NVDA Misses?
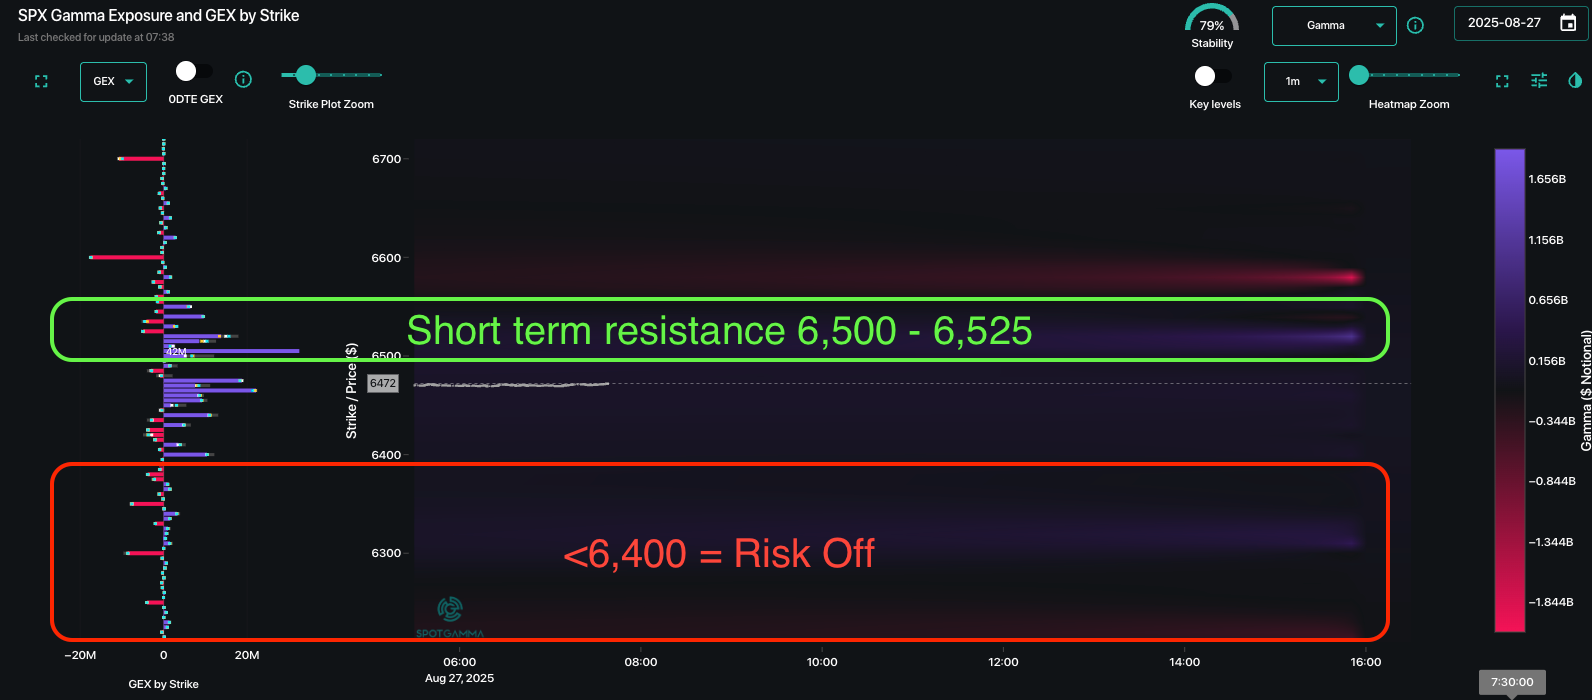
We’ve written an extensive outline for SpotGamma members highlighting the risks to this market if the SPX breaks <6,400. Below there negative gamma + a volatility jump may send the SPX into the 6,100’s.
Fore information on the TRACE chart below, go here.
love ur work, thanks for all u do… while my skill level is high w/o people like u we’d all be in the dark !